Web Server Statistics for uploads.jumuiyaenergy.com

Program started on Mon, Oct 28 2024 at 12:03 PM.
Analyzed requests from Fri, Jun 28 2024 at 9:16 AM to Mon, Oct 28 2024 at 6:27 AM (121.88 days).

General Summary

(Go To: Top | General Summary | Monthly Report | Daily Summary | Hourly Summary | Domain Report | Organization Report | Browser Report | Browser Summary | Operating System Report | Status Code Report | File Size Report | File Type Report | Directory Report | Request Report)

Figures in parentheses refer to the 7-day period ending Oct 28 2024 at 12:03 PM.

Successful requests: 21 (2)
Successful requests for pages: 5 (0)
Failed requests: 17 (0)
Redirected requests: 81 (0)
Distinct files requested: 9 (35)
Distinct hosts served: 13 (73)
Data transferred: 4.27 kilobytes (128 bytes)
Average data transferred per day: 35 bytes (18 bytes)

Monthly Report

(Go To: Top | General Summary | Monthly Report | Daily Summary | Hourly Summary | Domain Report | Organization Report | Browser Report | Browser Summary | Operating System Report | Status Code Report | File Size Report | File Type Report | Directory Report | Request Report)

Each unit (+) represents 1 request for a page.

month#reqs#pages 
Jun 2024175+++++
Jul 202400
Aug 202420
Sep 202400
Oct 202420

Busiest month: Jun 2024 (5 requests for pages).

Daily Summary

(Go To: Top | General Summary | Monthly Report | Daily Summary | Hourly Summary | Domain Report | Organization Report | Browser Report | Browser Summary | Operating System Report | Status Code Report | File Size Report | File Type Report | Directory Report | Request Report)

Each unit (+) represents 1 request for a page.
day#reqs#pages 
Sun00
Mon20
Tue00
Wed20
Thu00
Fri175+++++
Sat00

Hourly Summary

(Go To: Top | General Summary | Monthly Report | Daily Summary | Hourly Summary | Domain Report | Organization Report | Browser Report | Browser Summary | Operating System Report | Status Code Report | File Size Report | File Type Report | Directory Report | Request Report)

Each unit (+) represents 1 request for a page.

hour#reqs#pages 
000
100
200
300
400
500
640
700
800
9175+++++
1000
1100
1200
1300
1400
1500
1600
1700
1800
1900
2000
2100
2200
2300

Domain Report

(Go To: Top | General Summary | Monthly Report | Daily Summary | Hourly Summary | Domain Report | Organization Report | Browser Report | Browser Summary | Operating System Report | Status Code Report | File Size Report | File Type Report | Directory Report | Request Report)

Listing domains, sorted by the amount of traffic.

#reqs%bytesdomain
21100%[unresolved numerical addresses]

Organization Report

(Go To: Top | General Summary | Monthly Report | Daily Summary | Hourly Summary | Domain Report | Organization Report | Browser Report | Browser Summary | Operating System Report | Status Code Report | File Size Report | File Type Report | Directory Report | Request Report)

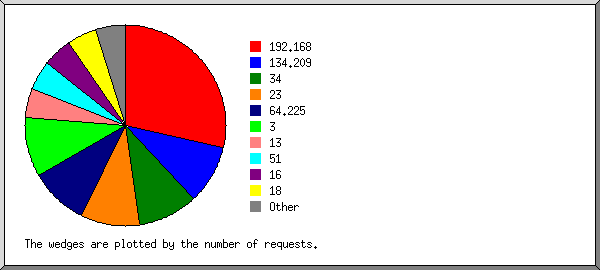
Listing organizations, sorted by the number of requests.

#reqs%bytesorganization
6 8.79%192.168
228.52%134.209
2 3.98%34
2 3.98%23
228.52%64.225
2 3.98%3
1 1.99%13
114.26%51
1 1.99%16
1 1.99%18
1 1.99%47

Browser Report

(Go To: Top | General Summary | Monthly Report | Daily Summary | Hourly Summary | Domain Report | Organization Report | Browser Report | Browser Summary | Operating System Report | Status Code Report | File Size Report | File Type Report | Directory Report | Request Report)

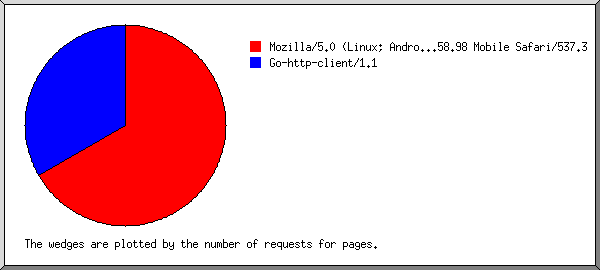
Listing browsers with at least 1 request for a page, sorted by the number of requests for pages.

#reqs#pagesbrowser
22Mozilla/5.0 (Linux; Android 6.0; HTC One M9 Build/MRA259537) AppleWebKit/537.36 (KHTML, like Gecko) Chrome/52.0.3558.98 Mobile Safari/537.3
11Go-http-client/1.1
160[not listed: 2 browsers]

Browser Summary

(Go To: Top | General Summary | Monthly Report | Daily Summary | Hourly Summary | Domain Report | Organization Report | Browser Report | Browser Summary | Operating System Report | Status Code Report | File Size Report | File Type Report | Directory Report | Request Report)

Listing browsers with at least 1 request for a page, sorted by the number of requests for pages.

##reqs#pagesbrowser
122Safari
 22  Safari/537
211Go-http-client
 11  Go-http-client/1
 160[not listed: 2 browsers]

Operating System Report

(Go To: Top | General Summary | Monthly Report | Daily Summary | Hourly Summary | Domain Report | Organization Report | Browser Report | Browser Summary | Operating System Report | Status Code Report | File Size Report | File Type Report | Directory Report | Request Report)

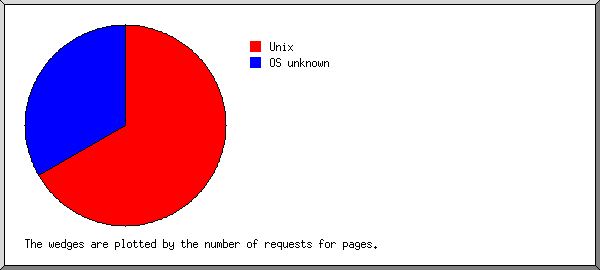
Listing operating systems, sorted by the number of requests for pages.

##reqs#pagesOS
122Unix
 22  Linux
2171OS unknown

Status Code Report

(Go To: Top | General Summary | Monthly Report | Daily Summary | Hourly Summary | Domain Report | Organization Report | Browser Report | Browser Summary | Operating System Report | Status Code Report | File Size Report | File Type Report | Directory Report | Request Report)

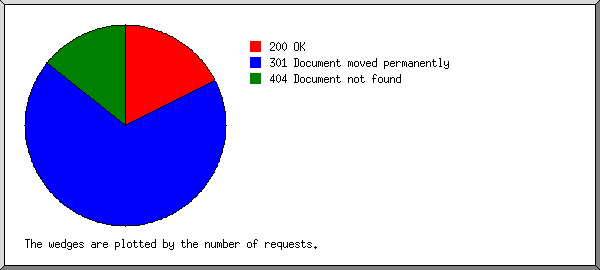
Listing status codes, sorted numerically.

#reqsstatus code
21200 OK
81301 Document moved permanently
17404 Document not found

File Size Report

(Go To: Top | General Summary | Monthly Report | Daily Summary | Hourly Summary | Domain Report | Organization Report | Browser Report | Browser Summary | Operating System Report | Status Code Report | File Size Report | File Type Report | Directory Report | Request Report)

size#reqs%bytes
00 
1B- 10B0 
11B- 100B1628.70%
101B- 1kB571.30%

File Type Report

(Go To: Top | General Summary | Monthly Report | Daily Summary | Hourly Summary | Domain Report | Organization Report | Browser Report | Browser Summary | Operating System Report | Status Code Report | File Size Report | File Type Report | Directory Report | Request Report)

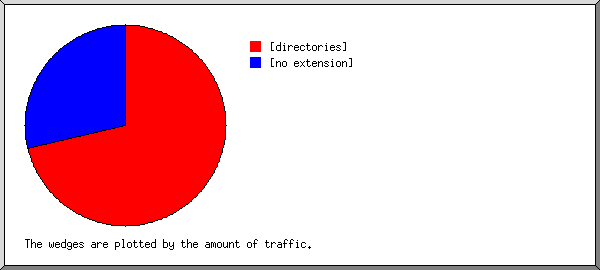
Listing extensions with at least 0.1% of the traffic, sorted by the amount of traffic.

#reqs%bytesextension
571.30%[directories]
1628.70%[no extension]

Directory Report

(Go To: Top | General Summary | Monthly Report | Daily Summary | Hourly Summary | Domain Report | Organization Report | Browser Report | Browser Summary | Operating System Report | Status Code Report | File Size Report | File Type Report | Directory Report | Request Report)

Listing directories with at least 0.01% of the traffic, sorted by the amount of traffic.

#reqs%bytesdirectory
571.30%[root directory]
1628.70%/.well-known/

Request Report

(Go To: Top | General Summary | Monthly Report | Daily Summary | Hourly Summary | Domain Report | Organization Report | Browser Report | Browser Summary | Operating System Report | Status Code Report | File Size Report | File Type Report | Directory Report | Request Report)

Listing files with at least 20 requests, sorted by the number of requests.

#reqs%byteslast timefile
21100%Oct/28/24 6:27 AM[not listed: 9 files]