Web Server Statistics for uploads.jumuiyaenergy.com
Program started on Thu, Aug 29 2024 at 5:35 AM.
Analyzed requests from Fri, Jun 28 2024 at 9:16 AM to Wed, Aug 28 2024 at 6:26 AM (60.88 days).
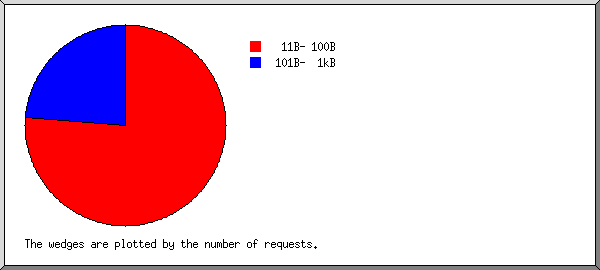
 ) represents 1 request for a page.